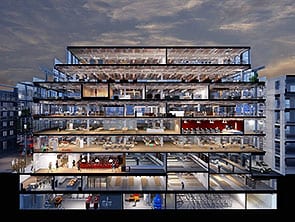
 Section through Tileyard Studios|||
Pilbrow & Partners’ geolocation software enables analysis of city growth and opens up new possibilities for urban designers.
In cities, let alone big megalopolises like London, design strategy and urban planning go hand in hand. Which areas have been most prosperous and which are yet to bear fruit? Where should developers invest? What kind of demand is there for services, jobs and infrastructure?
London-based architecture and urban design studio Pilbrow & Partners has developed a 3D modelling geo-locating tool that offers intriguing insights into urban planning and development, which will ultimately help architects make better design decisions on a micro level.
“Over the years, land use is changing, and this evolution is driven by different socio-economic, ecological, and geographical factors. Much information is hidden in various databases – a lot is even publicly available,” says Pilbrow & Partners, which has researched a combination of public datasets from Companies House, Nomis — a service from the Office for National Statistics on labour market data — and the Inter-Departmental Business Register (IDBR), to follow the birth and development of areas across London where certain sectors thrive, and “to anticipate how a site might best engage with the economic potential such clusters provide”.
Tracking London’s growth through maps
The financial cluster in Canary Wharf and cluster of tech startups in Old Street, the so-called Silicon Roundabout, are well known examples of such areas. “Their continuing transformation over time is useful to analyse, particularly considering the impact these clusters continue to have on the future of their immediate and surrounding neighbourhoods and the network of other spatially and economically overlapping social and economic clusters,” the firm explains.
In London, the team has so far identified the music and tech industries, the retail market and biomedical business, but it has also looked at other UK cities such as Birmingham, Manchester, Leeds, Oxford, Cambridge, Brighton and Bath. “The available data covers the entire UK, which makes it possible to apply this research throughout the whole of the nation,” they say.

These maps demonstrate the growth in clusters in London
One example where this has been put to use is Tileyard Studios, a creative hub just off York Way in King’s Cross, where leading businesses in performance, management, production and technology occupy more than 70 music studios and office space. As part of Pilbrow & Partners’ masterplan guiding the growth of the studios’ estate, its new building is expected to be a force in London’s music industry.
“Over the last eight years, Tileyard has developed to become the most significant cluster in Europe, with over 400 companies sharing a dense network of connections to support their growth and development,” the practice explains. “We analysed the evolution and development of a cluster of music companies in Islington which helps to demonstrate the strategic importance of Tileyard to the wider London economy.”
How does the geolocation tool work?
To show the potential impact of such areas, Pilbrow & Partners use a variety of technologies. “We have used 3D modelling, data visualisation and GIS [Geographic Information System] software for mapping. From there on, we have developed and applied density-based spatial clustering algorithms to find companies within geo-spatial agglomerations. In the application of these technologies, we apply quantitative research and analysis […] and we are mapping this data within a continuous geographical space using a company’s postcode, rather than mapping this within a discrete geographical space like a borough or ward.”
More data sets are becoming available, giving greater insight. “In the end we believe it will therefore help us as architects to create better places to live and work, which is what we try to accomplish and value the most in our profession.”
Pilbrow & Partners’ geolocation software enables analysis of city growth and opens up new possibilities for urban designers


